User Interface
Overview
When you first open JARU IDE, you'll find a modern dark-themed interface designed to minimize eye strain during long programming sessions. The main window is organized into several areas that you can customize to suit your workflow, as all panels are dockable and can be freely rearranged.
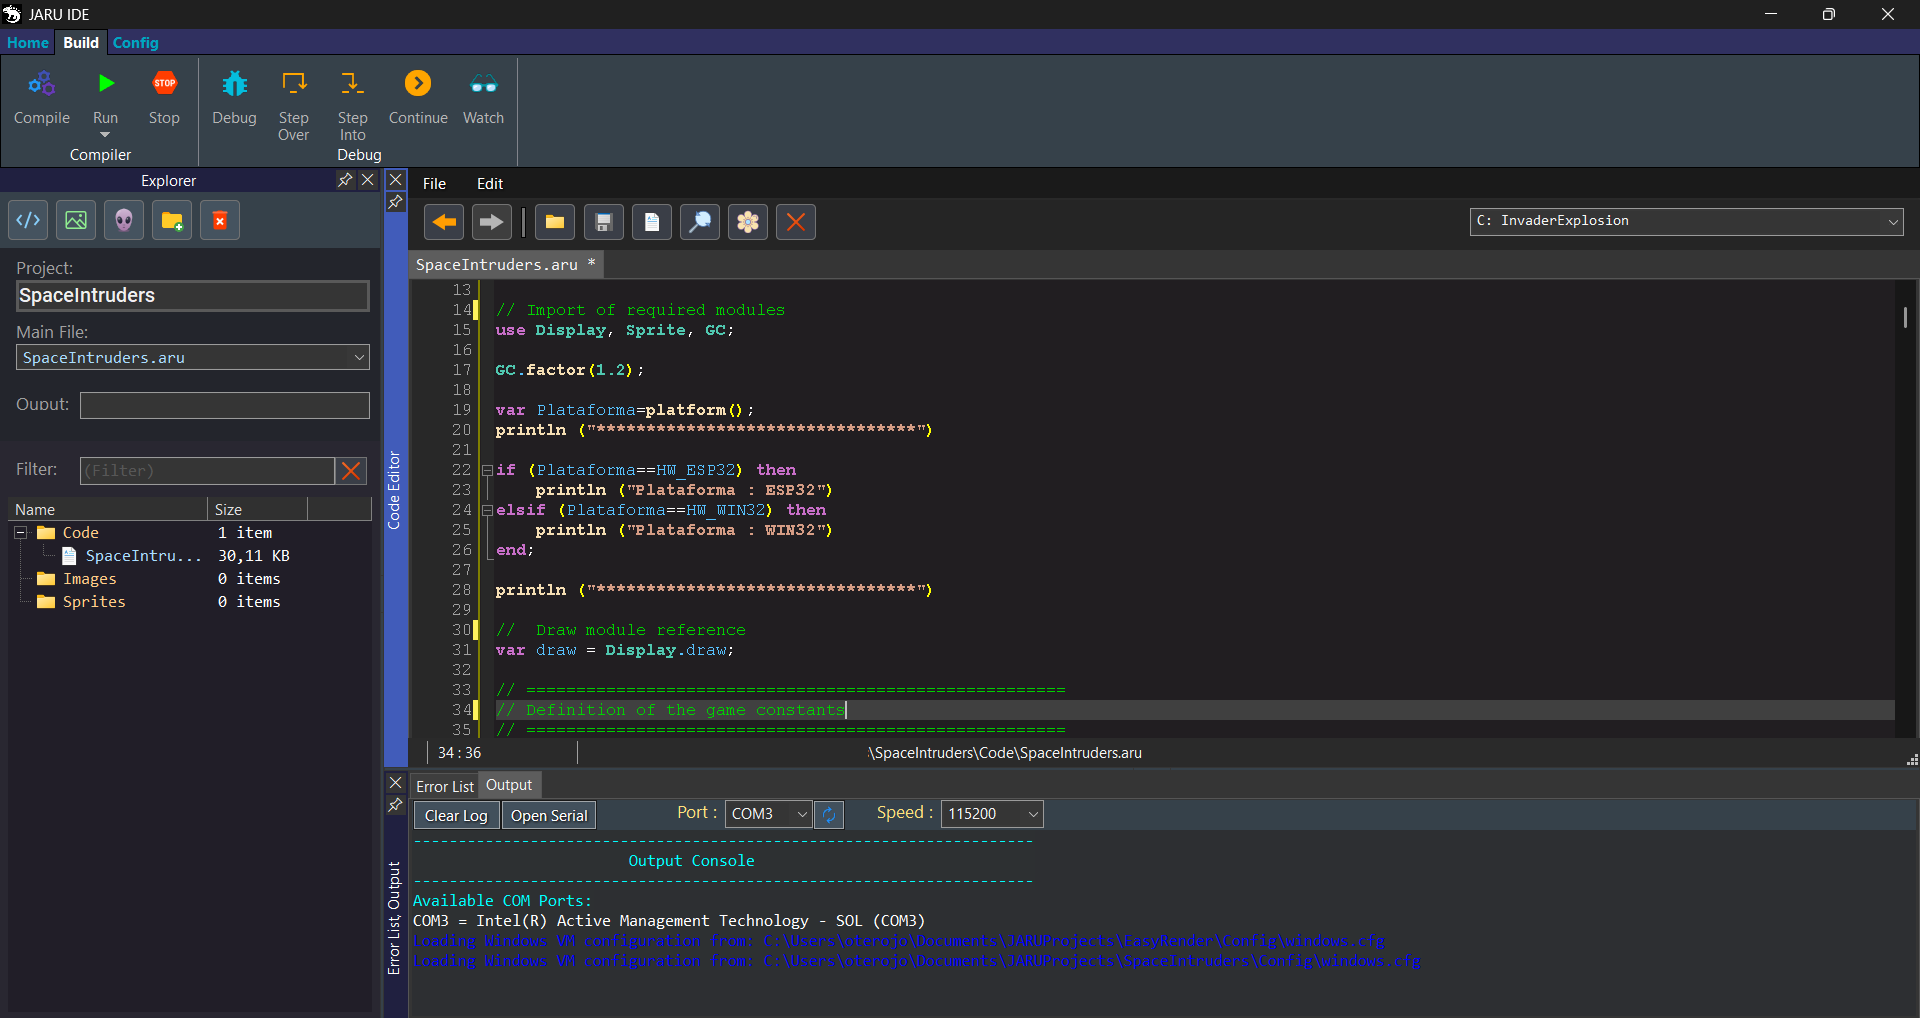
At the top you'll find the Ribbon toolbar, which groups all functions into themed tabs. The central area is occupied by the code editor, where you'll spend most of your time writing programs. On the left side is the project explorer showing the file structure, and at the bottom the output console displays compilation and execution results.
The Ribbon Toolbar
JARU IDE uses a Ribbon-style toolbar, similar to what you'll find in applications like Microsoft Office. This bar organizes all IDE functions into three main tabs: Home, Build, and Config.
Home Tab
The Home tab is your starting point and contains the functions you'll use most frequently. It's divided into two panels: Project and View.
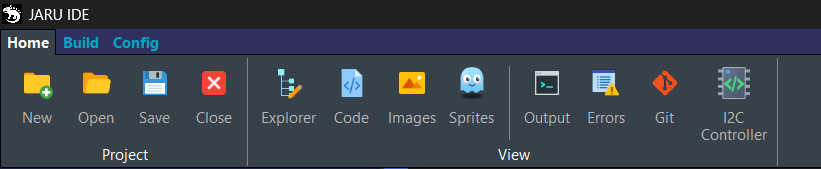
The Project panel groups basic project management operations. The New button opens the project creation wizard, which will guide you step by step through the initial setup. Open allows you to load an existing project through a file selection dialog. Save saves all modified files in the current project, including code, images, and sprites. Finally, Close closes the active project, freeing resources and preparing the IDE to open another project.
The View panel controls which windows and panels are visible in the IDE. Each button shows or hides a specific panel, allowing you to customize your workspace according to the task at hand. Explorer displays the project file tree. Code opens the source code editor. Images provides access to the image editor. Sprites opens the animation editor. Output shows the output console with compilation and execution messages. Errors presents the list of project errors and warnings. Git opens the integrated version control panel. I2C Controller provides access to the driver manager for I2C sensors and actuators.
Build Tab
The Build tab contains everything related to compiling, running, and debugging your programs. It's divided into two panels: Compiler and Debug.
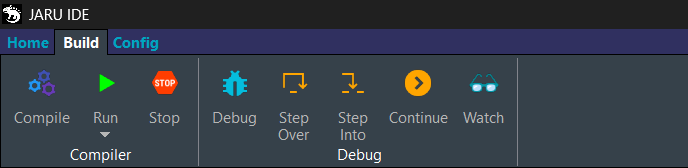
The Compiler panel manages the build and execution process. The Compile button processes your source code and generates the executable, showing any errors or warnings in the output console. If there are syntax or semantic errors, they'll appear in red with information about the file and line where they're located. The Run button goes one step further: it first compiles the project and then automatically executes it. This button includes a dropdown menu that lets you select the target platform (Windows VM or ESP32) before running. The Stop button halts the current execution, whether it's a program running normally or an active debugging session.
The Debug panel provides tools for debugging your code step by step. The Debug button starts a debugging session: it first compiles the project and then runs it in debug mode, stopping at the first breakpoint it encounters. Step Over executes the current line completely; if the line contains a function call, it executes the entire function without entering it. Step Into also executes the current line, but if there's a function call, it enters inside it so you can debug it line by line. Continue resumes normal program execution until it finds the next breakpoint or finishes. Watch opens the variable inspection window, where you can add variables to observe how their values change during debugging.
Config Tab
The Config tab groups IDE configuration options and platform-specific tools. It contains two panels: Platform and IDE.

The Platform panel provides access to platform-specific configuration tools. The Windows button opens the Windows virtual machine configuration panel, where you can adjust execution parameters for local development. The ESP32 button opens a complete tools panel for working with ESP32 microcontrollers, including firmware flashing, WiFi configuration, MQTT, TFT display, SD card, and chip information reading.
The IDE panel contains general environment settings. Settings opens the options dialog where you can customize editor behavior, colors, fonts, and other preferences. About displays information about the JARU IDE version and project credits.
The Project Explorer
The left side panel displays your project structure as a hierarchical tree. Here you'll see all files organized by folders: source code, images, sprites, and any other resources that are part of the project.
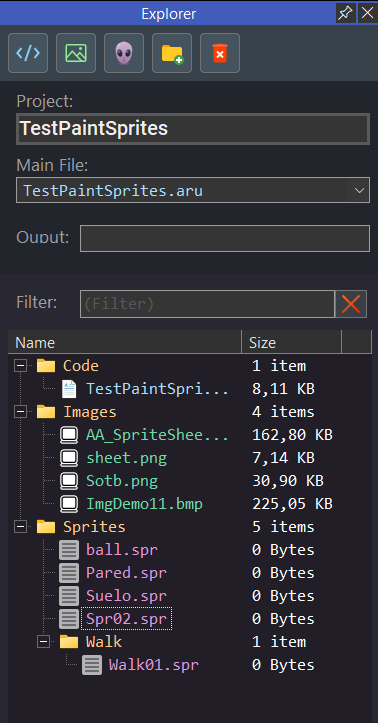
At the top of the explorer there's a toolbar with buttons to quickly create new elements: code files, images, sprites, or folders. You can also right-click on any element to access a context menu with additional options like rename, delete, or open location in Windows Explorer.
An important feature is the main file selector. In projects with multiple code files, this is where you indicate which is the entry point of your program, meaning the file that contains the code that should run first.
To reorganize the structure you can drag and drop elements between folders. The explorer also includes a filter field that lets you quickly search for files by typing part of their name.
The Code Editor
The heart of the IDE is the code editor, a tabbed workspace that lets you have multiple files open simultaneously. Each time you double-click a file in the explorer, it opens in a new tab (or activates the existing tab if it was already open).
Editor Features
The editor includes syntax highlighting specific to the JARU programming language, coloring keywords, strings, numbers, and comments differently to make code easier to read. Line numbering in the left margin helps you navigate, and next to it you'll see indicators marking which lines you've modified since the last save.
Autocompletion is one of the most useful features for programming fluently. As you type, the editor suggests keywords, function names, and variables that match what you're typing. You can accept a suggestion with Enter or Tab, or keep typing to filter the options. If autocompletion doesn't appear automatically, you can invoke it manually with Ctrl+Space.
At the top of the editor you'll find a symbol navigator: a dropdown that lists all functions and classes in the current file. Selecting an element takes you directly to its definition, which is very useful in long files.
Search and Replace
Pressing Ctrl+F reveals the search panel at the top of the editor. Type the text you're looking for and use the navigation buttons to jump between matches. The counter tells you how many times the text appears in the file.
You can refine the search by enabling options like exact match (case-sensitive) or whole words (doesn't find the text if it's part of a longer word).
To replace text, expand the search panel with the corresponding button. A second field will appear where you can type the replacement text, along with buttons to replace the current match or all matches at once.
The Code Formatter
The Beautifier button automatically applies consistent formatting to your code. It adjusts indentation, spacing around operators, and general alignment to make code more readable and follow a uniform style. It's especially useful when pasting code from other sources or when you want to clean up a file that has passed through many hands.
Working with Breakpoints
To debug your code you need to set breakpoints, points where execution will stop so you can examine the program's state. Simply click in the left margin, next to the line number where you want to pause. A red indicator will appear marking the breakpoint. Click again to remove it.
When you run the program in debug mode, it will stop each time it reaches a line with a breakpoint, allowing you to inspect variables, step through execution, and understand exactly what your code is doing.
The Output Console
The bottom panel is your window to the program's outside world. All messages generated during compilation and execution appear here.
When you compile, you'll see the process progress and any errors or warnings the compiler finds. Errors appear in red with information about the file, line, and description of the problem. Warnings are shown in yellow. Double-clicking on an error message takes you directly to the problematic line in the editor.
During execution, the console shows your program's output: everything you print with standard output functions will appear here.
The Serial Monitor
When working with ESP32 devices, the console includes an integrated serial monitor. In the top bar you can select the COM port where your device is connected and the communication speed (baud rate). The connect button opens the port and starts displaying the data the device sends.
This is especially useful for debugging embedded applications, as you can see diagnostic messages and your program's output running on real hardware.
The Watch Window
During a debugging session, the Watch window lets you observe variable values in real-time. Type a variable name in the input field and press Enter to add it to the watch list.
Each time execution stops (at a breakpoint or after a step), values are automatically updated. If the variable is an array or structure, you can expand it to see its internal contents.
The toolbar buttons let you manually refresh values, add new variables, or remove ones you no longer need to watch. This tool is fundamental for understanding your program's flow and detecting where values aren't what you expected.
Version Control with Git
JARU IDE includes a complete Git client that lets you manage your code history without leaving the development environment. The version control panel is divided into several views covering all common operations.
Status View
The main view shows the current state of your repository. At the top you see unstaged files: changes you've made but haven't yet marked for inclusion in the next commit. Below appear staged files: those that will be included.
You can move files between these lists by clicking on them or using buttons to stage all changes at once. Below there's a text area to write the message describing your changes, and the Commit button to confirm them.
Branches View
Here you manage your project's branches. You see a list of all local and remote branches, with an indication of which is the active branch. You can create new branches, switch between them (checkout), merge one branch with another, or delete branches you no longer need.
History View
This view shows the project's commit history. Each entry includes the commit hash, author, date, and descriptive message. When selecting a commit, you can see which files were modified and the complete details of the change.
Remote Operations
If your repository is connected to a remote server (like GitHub or GitLab), the Push and Pull buttons let you synchronize changes. Push uploads your local commits to the server, while Pull downloads changes others have pushed. The Fetch button updates information about the remote state without modifying your local code.
ESP32 Tools
The ESP32 tools panel centralizes all configuration needed for working with these microcontrollers. It's organized into sections for different aspects of the device.
The flashing section lets you load firmware onto the chip, with options to select flash mode and transfer speed. The WiFi section configures network credentials and IP parameters. If your application uses MQTT for IoT communication, you'll find all broker connection settings in its corresponding section.
You can also configure the TFT display (pins, resolution, controller model), the SD card, and read chip information like its MAC address or unique identifier.
I2C Driver Manager
This tool saves you time when you need to communicate with sensors and actuators that use the I2C bus. The panel shows a catalog of drivers organized by categories: temperature sensors, accelerometers, displays, etc.
When selecting a driver, you see detailed information about the chip it controls, its I2C address, driver version, and who developed it. A methods tab lists all available functions, and another tab shows a code preview.
Before inserting code into your project, configure the SDA and SCL pins you're using and the I2C port. The insert button automatically adds the driver initialization and usage code in the editor, ready for you to adapt to your needs.
Visual Editors
JARU IDE includes specialized editors for working with graphical resources, which open directly in tabs in the central area.
Image Editor
When you double-click an image in the project, it opens in the image editor. Here you can zoom in to examine details, crop specific areas, and convert the color palette to optimize size on embedded devices.
Palette options include keeping original colors, reducing to 256 colors, or using a unified project palette. You can also configure the output size if you need to scale the image.
Sprite Editor
Sprites are animations composed of multiple frames. The sprite editor lets you define the regions of an image that correspond to each frame, organize them in sequence, and preview the resulting animation.
Playback controls let you see the animation in motion, adjust speed (FPS), and navigate frame by frame. You can configure sprite alignment and background color for preview.
Workspace Customization
A fundamental feature of JARU IDE is its dockable panel system. You can drag any panel by its title bar and drop it in another position: to the left, right, above, or below another panel, or even stacked as tabs in the same space.
This lets you create the layout that best suits your workflow. For example, you could put the explorer on the right instead of the left, or stack the Watch window next to the console. You can also undock panels as independent floating windows, useful if you have multiple monitors.
The IDE remembers your configuration, so when you close and reopen it, you'll find everything where you left it.
If you ever "lose" a panel and can't find it, you can restore it from the View panel in the Home tab of the Ribbon toolbar.
Keyboard Shortcuts
To work more fluidly, JARU IDE supports numerous keyboard shortcuts. The most important ones are:
File management: Ctrl+N creates a new file, Ctrl+O opens an existing one, Ctrl+S saves the current one, and Ctrl+W closes the active tab.
Editing: Ctrl+Z undoes the last change, Ctrl+Y redoes it. Ctrl+C, Ctrl+X, and Ctrl+V copy, cut, and paste respectively. Ctrl+F opens search and Ctrl+H opens search with replace.
Compilation and execution: F7 compiles the project, F5 runs it, and Shift+F5 stops execution.
Debugging: F9 adds or removes a breakpoint at the current line. During a debugging session, F10 steps without entering functions, F11 enters the called function, and F5 continues execution to the next breakpoint.
Advanced editing: Ctrl+J activates synchronized identifier editing, letting you rename a variable in all its occurrences simultaneously.